Overview
We are going to work on 10 Realtime projects for sufficient hands-on experience which can be used in your resumes. This course fits both beginners and experienced professionals. I can guarantee no course better than this is available in Market at this reasonable price. You have an option to receive Internship Certificate from CloudLogz LLC, San Diego, CA, United States without any additional cost.
You’ll Learn
Course Structure
- Introduction to Cloud Big Data.
- Introduction to Azure Data Lake Storage Account.
- Different Access Methods to access ADLS Gen2.
- Service Principal/ Managed Identity.
- Storage Container, BLOB File Uploads.
- Data Loads with Azure BLOB Files.
- Azure Data Factory Fundamentals.
- Integration Run Time
- Self-Hosted IR
- Azure Hosted IR
- Azure SSIS
- Linked Services.
- Data Source for different file formats.
- Integration of ADF with Azure DevOps/ GitHub.
- Assignment and Realtime Interview questions.
- Familiarity with REST API and its usage in Big Data.
- Different Activities: –
- Copy Activity
- Lookup Activity
- Get Metadata
- For Each
- Validation
- Conditional
- Stored Procedure
- Data Source, Linked Service, and Pipeline parametrization
- ADF Pipelines: Execution Settings
- ADF Logging Options, Consistency Check
- Compression Option, DOP and DOCP
- Assignment and Realtime Interview Questions
- Data Flow Task, Data Flow Activity
- Transformations with Data Flow
- Spark Cluster for Debugging
- Cluster Node Configurations
- Data Preview Options with DFT
- Various Narrow Transformation & Options
- Derived Column Transformations
- Exists & Lookup Transformations
- JOIN Transformation and Usage
- Conditional Split Transformation
- Aggregate & Group by Transformations
- DFT Optimization Techniques
- Spark Cluster for Pipeline Executions
- Pipeline Monitoring & Run IDs
- Assignment and Realtime Interview Questions
- Data Quality Check using Data Factory.
- Quarantine bad records to ERROR
- Email Bad Records with attachment to Users.
- Pivot Transformation for Normalization
- Pivot Transformation for Normalization
- Generating Pivot Column, Aggregations
- Pivot Transformation and Pivot Settings
- Pivot Key Selection, Value and Nulls
- Pivoted Columns and Column Pattern
- Window Functions & Usage in Data Flow
- Rank / Dense Rank / Row Number
- Over Clause and Input Options
- Pipeline Validations & Executions
- Assignment and Realtime Interview Questions
- On Prem Incremental Data Loading using Meta Data Driven Pipelines
- Custom Logging
- Project Work Discussion.
- Realtime Interview Questions
- Incremental Data File Loading using ADF and its challenges.
- Triggers
- Schedule
- Storage
- Tumbling
- Performance Tuning of Data Factory Pipelines
- How to debug existing pipelines and modify based on real time enhancement request.
- Assignment and Realtime Interview Questions
- Apache Spark Architecture
- Spark’s internal details (Driver, Executor, task, stages, jobs etc.)
- Spark Memory Allocation (Driver and Executor Memory Allocation)
- Cluster Deployment Modes (Client, Cluster)
- Narrow and Wide Transformations
- Spark different configurations
- OOM ERRORS and its common causes
- Interview Questions based on Apache Spark Architecture
- Introduction to Databricks
- Walkthrough of Databricks workspace
- Different types of clusters and their uses.
- Magic Commands, DBUTILS, Secret Scopes
- Notebook Parametrization
- Accessing Blob Storage/ ADLS Gen 2 using notebook
- Understanding of DBFS
- Interview Questions based on session.
- Assignments
-
PySpark Data Processing
- Different File Types and selecting the optimal file types.
- Read different file formats (CSV, JSON, Parquet. etc.)
- Different reading and writing options.
- Interview Questions based on session.
- Assignments to be completed within session.
-
PySpark Transformations
- Wide
- Narrow
- Joins
- Actions
-
Spark SQL
- Databricks Database
- Global Temporary View, Temporary View, View
- External Tables, Managed Tables
- Joins
- Interview Questions based on session.
- Assignments
-
Lakehouse Architecture
- Delta Tables
- Time Travel, History, Vacuum
- DML operations on Delta Tables
- CDC (Change Data Capture)
- Incremental File Loading
- Interview Questions based on session.
- Assignments
-
Unity Catalog
- Benefits of Unity Catalog (Data Governance)
- Data Lineage, Data Auditing
- Upgrade Hive Meta store to Unity Catalog
- Interview Questions on Unity Catalog
- Assignments
-
Structured Streaming
- Different sources, IoT hub, Kafka etc.
- Stateless/Stateful Transformations
- Output Modes (Complete, Update, Append)
- Tumbling and Sliding Window
-
Structured Streaming Continued.
- Watermarking
- Stream Joins
- Kafka Sink
- Cosmos Sink
- File Sink
-
Delta LIVE Tables
- Quality Checks
- Data Quarantine
- Structured Streaming using Delta LIVE Tables
- Autoloader
- Interview Questions
-
Pipeline Optimizations (100% Practical)
- Identify the root cause of performance issue (RCA)
- Different options to tune the performance.
- Skew—Resolve Skew
- Shuffle—Reduce Shuffle
- Spill—Resolve Spill
- Caching/ Delta Caching- Difference between both
- Caching/ Delta Caching- Difference between both
Reserved for Project Work and Productionizing the Pipeline using CI/CD.
Instructor
Request Demo
Live Project
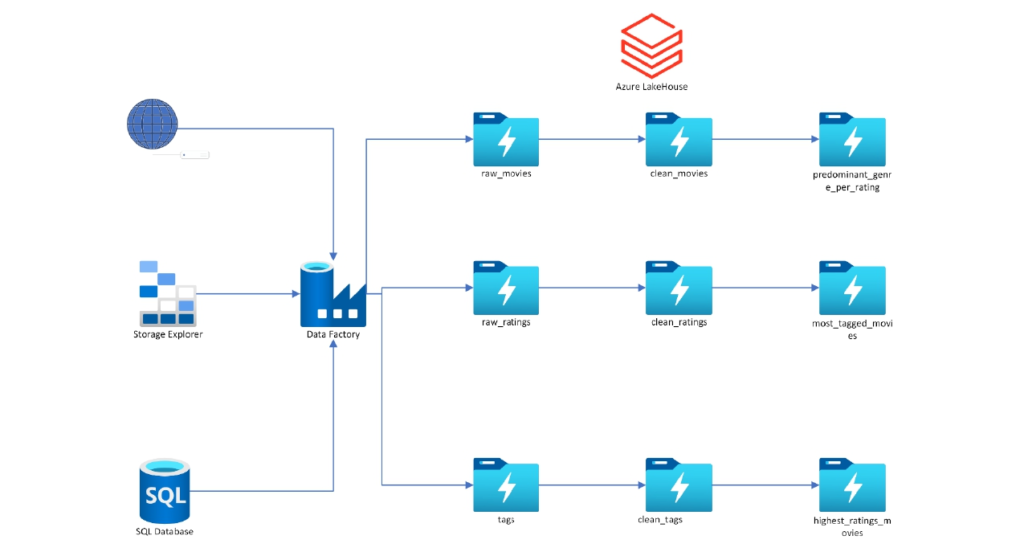
Movies Ratings Analysis Architecture
Analyze and implement the Lakehouse for below requirements: –
- Show the aggregated number of ratings per year
- Show the rating levels distribution.
- Show the 18 movies that are tagged but not rated.
- Focusing on the rated untagged movies with more than 30 user ratings, show the top 10 movies in terms of average rating and number of ratings.
- What is the average number of tags per movie in tags? And the average number of tags per user? How does it compare with the average number of tags a user assigns to a movie?
- Identify the users that tagged movies without rating them.
- What is the predominant (frequency based) genre per rating level?
- What is the predominant tag per genre and the most tagged genres?
- What are the most predominant (popularity based) movies?
- Top 10 movies in terms of average rating (provided more than 30 users reviewed them)
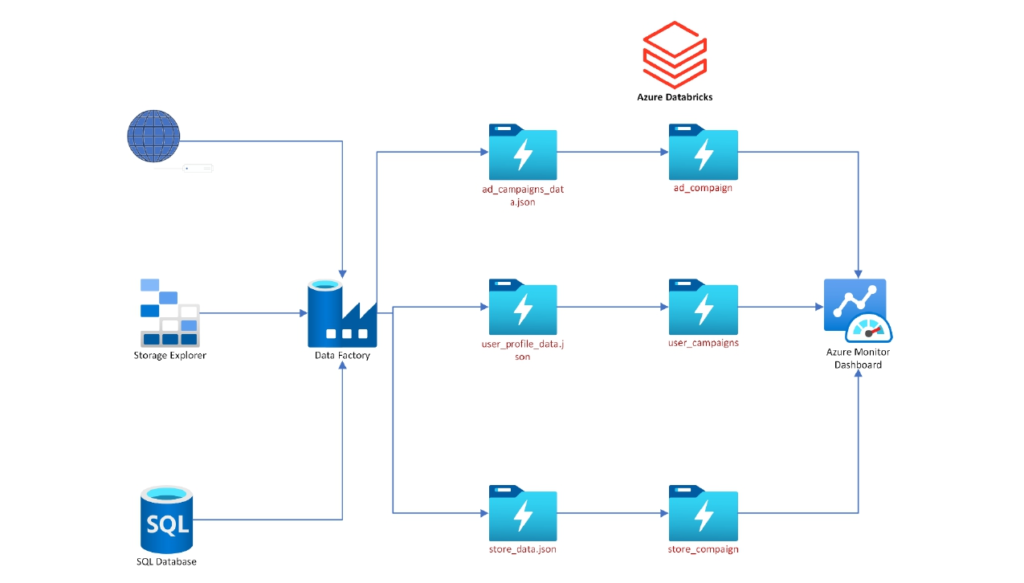
loudLogz is the marketing company which gets the data from various sources in different formats and would like to ingest the data into their data lake and perform the analysis below.
-
- Analyze data for each campaign, date, hour, os_type & value to get all the events with counts.
- Analyze data for each campaign, date, hour, store_name & value to get all the events with counts.
- Analyze data for each campaign, date, hour, gender_type & value to get all the events with counts.
Market Compaign Analysis Architecture
We will be working with transactional data referring to loan transactions and customers from US Bank (a famous bank around the world). You have two requirements from different areas of the bank
- The Marketing team needs to have updated customer data to be able to contact them and make offers.
- The Finance area requires us to have daily loan transactions complemented with customer drivers to be able to analyze them and improve the revenue.
To comply with the request, we are going to perform incremental loads and use Databricks delta tables.
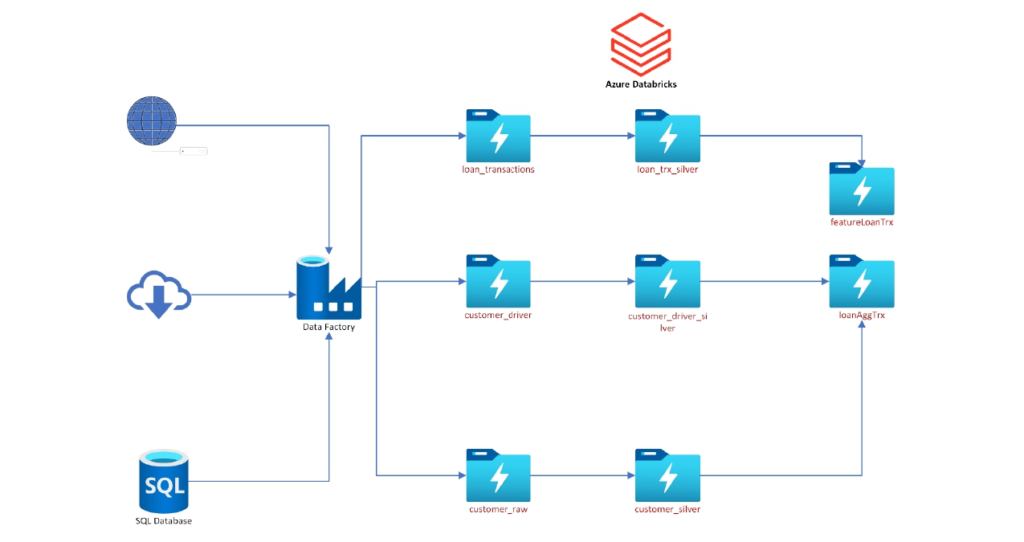
Financials-Bank Loan Analysis
Key Take Aways:- Learn end to end pipeline development and leverage your understanding to implement delta lakehouse for incremental data loading.
Adventure Works is Bi-Cycle company, and they are planning to migrate their data from On Prem SQL Server to Azure. They have a list of 31 Tables which needs to be migrated to Azure. Scenarios include Manufacturing, Sales, Purchasing, Product Management, Contact Management, and Human Resources.
Design a develop a pipeline as per below requirements: –
- Data Pipeline should incrementally load the data from on prem to azure.
- Design the pipeline in such a way that if we want to add or remove any table from the list of tables, no changes to the pipeline are required.
- Optimize the performance of the Pipeline.
- Make sure that data is consistent in on prem and azure.
- Use Azure DevOps to deploy the pipeline to Test and Prod.
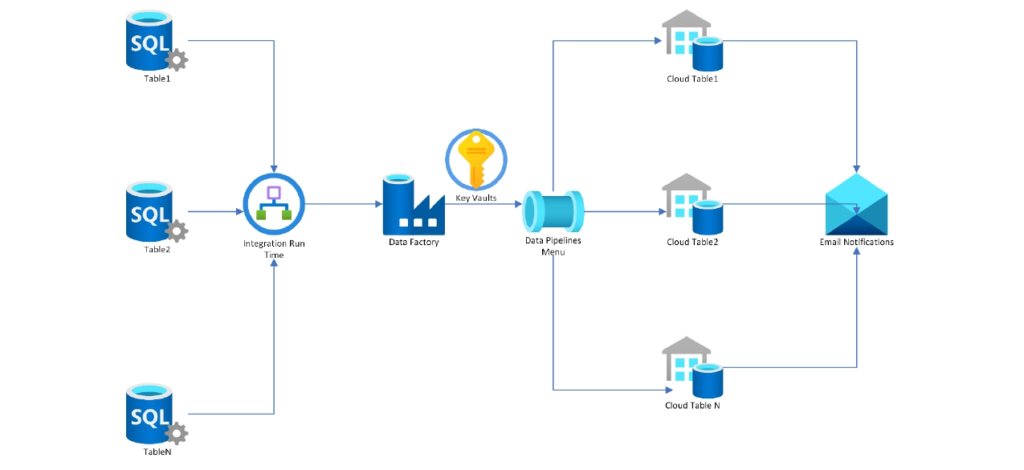
On-Prem to Cloud Data Migration Architecture Key Take Aways: –
Meta Data Driven Pipeline development using Data Factory and using Best Practices for data consistency and optimization.
The COVID-19 pandemic also known as coronavirus pandemic is the ongoing outbreak of coronavirus disease (COVID-19). It is caused by a coronavirus called severe acute respiratory syndrome coronavirus 2 (SARS-CoV-2).The outbreak was identified in Wuhan, China, in December 2019. The World Health Organization declared the outbreak a Public Health Emergency of International Concern on 30 January, and a pandemic on 11 March. Common symptoms include fever, cough, fatigue, shortness of breath, and loss of smell. Complications may include pneumonia and acute respiratory distress syndrome. The time from exposure to onset of symptoms is typically around five days, but may range from two to fourteen days. There is no known vaccine or specific antiviral treatment. Primary treatment is symptomatic and supportive therapy.
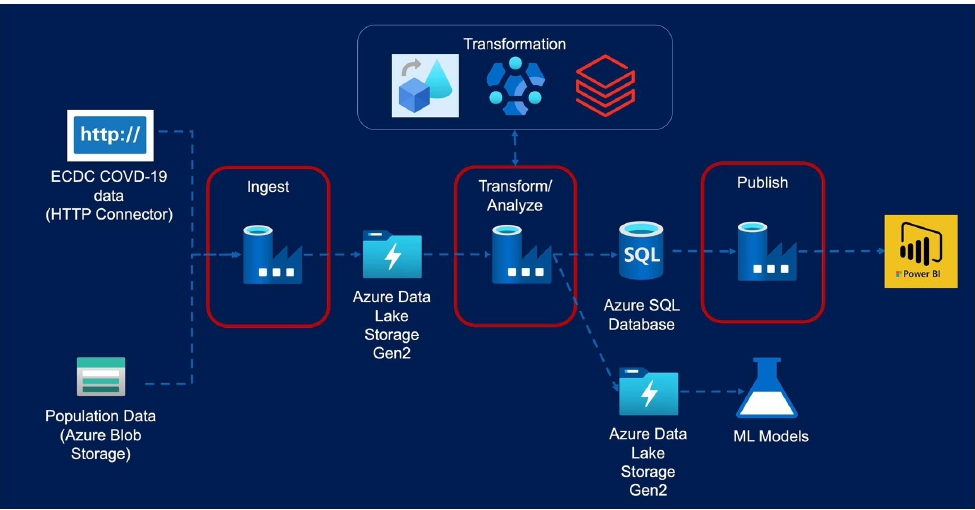
Key Learning: – Implement end to end pipeline using Data Factory and process different format files coming from different sources.
- Azure Data Lake Storage Gen2
- Azure Blob Storage
- Key Vault
- Data Factory
- SQL Database
- Data Flows Transformations
Out of stock (OOS) is one of the biggest problems in Supply Chain Management for any store. This project shows how OOS can be solved with real-time data and analytics by using theDatabricks Lakehouse Platform to solve on-shelf availability in real time to increase retail sales. The project can also be used for supply chain solutions.
- Use real-time insights to rapidly respond to demand.
- Drive more sales with on-shelf availability.
- Scale-out your solution to accommodate any size operation.
A bit different from OOS issues are on-shelf availability (OSA) problems where inventory may be in the store, but it’s not placed in a manner that makes it easily accessible to customers. A product may be in inventory, but the principal display may give the impression that the item is out of stock or in low quantity. Items may be on the shelf but not pulled forward in a manner that makes them easily viewable by customers. Product may be technically in inventory but in a backroom that’s not accessible to customers. Regardless of the reason, OSA issues tend to lead to lost revenue for retailers.
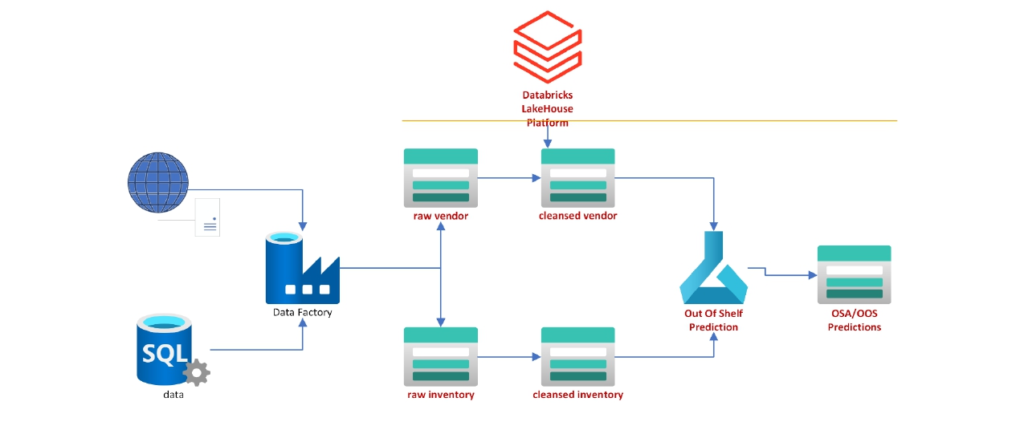
Key Learnings
- Use ADL Gen2 for Bronze, Silver and Gold Layer.
- Data Factory- Ingest data from different sources(Data Sets, IR, Linked Service)
- Databricks- Using py-Spark implement Lakehouse.
- MlFlow—Use of predefined ML Model.
- Analyse OOS and OSA
- ADF Pipeline Orchestration.
Adverse Drug Reaction Incidents (ADRI) are potentially very dangerous to patients and are top causes of morbidity and mortality. Many ADRIs are hard to discover as they happen to certain groups of people in certain conditions, and they may take a long time to expose. Healthcare providers conduct clinical trials to discover ADRI before selling the products but normally are limited in numbers. Thus, post-market drug safety monitoring is required to help discover ADRI after the drugs are sold on the market.
Less than 5% of ADRIs are reported via official channels and the vast majority is described in free-text channels: emails & phone calls to patient support centers, social media posts, sales conversations between clinicians and pharma sales reps, online patient forums, and so on. This requires pharmaceuticals and drug safety groups to monitor and analyze unstructured medical text from a variety of jargons, formats, channels, and languages – with needs for timeliness and scale that require automation.
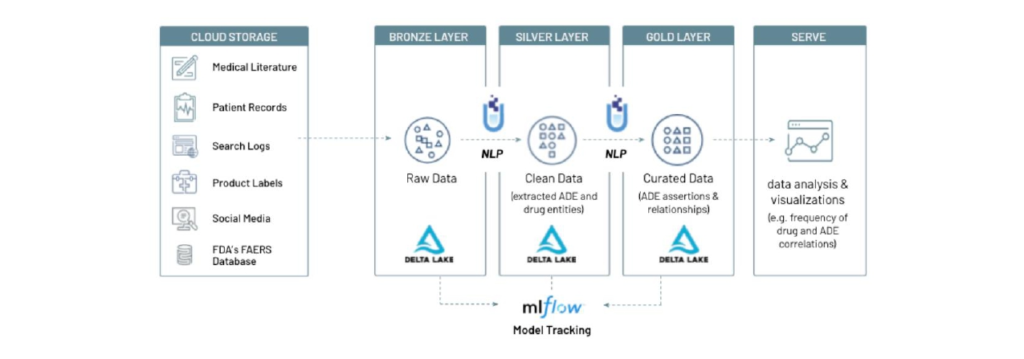
In this project, we show how to use Spark NLP’s existing models to process conversational text and extract highly specialized ADRI and DRUG information, store the data in Lakehouse, and analyze the data for various downstream use cases, including
- Conversational Texts ADE Classification
- Detecting ADE and Drug Entities from Texts
- Analysis of Drug and ADE Entities
- Finding Drugs and ADEs Have Been Talked Most
- Detecting Most Common Drug-ADE Pairs
- Checking Assertion Status of ADEs
- Relations Between ADEs and Drugs
Key Take Aways: –
- Azure Data Lake Storage Gen2, Azure Data Factory, Azure Key Vault
- Azure Databricks +Machine Learning- Use the prebuilt NLP Model for ADE Detection.
- Medallion Architecture Implementation
RMI is the process of collecting and analyzing data from the processing of transactions at a retail store. When a customer checks out, the data from that transaction feeds into several categories: inventory, sales, product, customer, and staff.
With volatility in the market and narrowing margins in retail, RMI analytics is critical for retailers to ensure they are running their inventory management program as effectively as possible. If an RMI system stores and reports data about inventory, retailers can have a better idea of what they’re selling, what they’re storing and what isn’t moving.
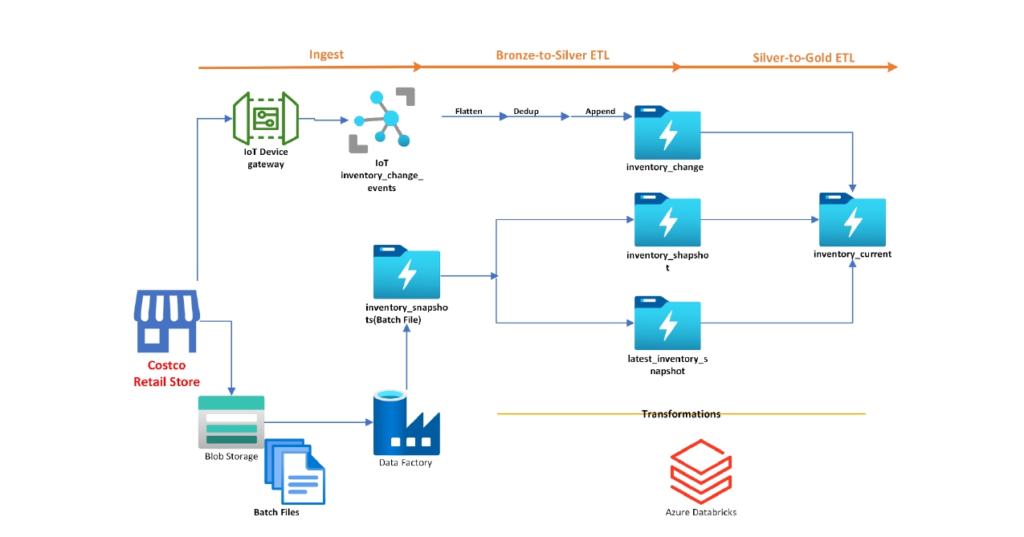
Get started with our Solution for Real-Time Retail-Margin-Improvement Analytics to improve in-store operations by: Real-time Retail-Margin-Improvement Analytics to improve in-store operations by:
- Rapidly ingesting all data sources and types at scale
- Building highly scalable streaming data pipelines with Delta Live Tables to obtain a real- time view of your operation.
- Leveraging real-time insights to tackle your most pressing in-store information needs.
- Key Take Aways: –
- Blob Storage Account
- Azure Data Factory for Batch Processing
- Azure Key Vault
- Azure Data Lake Storage Gen2
- Azure IoT Hub- Learn in action not just theory.
- Azure Databricks for Transformations
- Delta Live Implementation
- Medallion Architecture Implementation
As traditional pay TV continues to stagnate, content owners have embraced direct-to-consumer (D2C) subscription and ad-supported streaming for monetizing their libraries of content. For companies whose entire business model revolved around producing great content which they then licensed to distributors, the shift to now owning the entire glass-to-glass experience has required new capabilities such as building media supply chains for content delivery to consumers, supporting apps for a myriad of devices and operating systems, and performing customer relationship functions like billing and customer service.
With most vMVPD (virtual multichannel video programming distributor) and SVOD (streaming video on demand) services renewing monthly, subscription service operators need to prove value to their subscribers every month/week/day (the barriers to a viewer for leaving AVOD (ad-supported video on demand) are even lower – simply opening a different app or channel). General quality of streaming video issues (encompassing buffering, latency, pixelation, jitter, packet loss, and the blank screen) have significant business impacts, whether it’s increased subscriber churn or decreased video engagement.
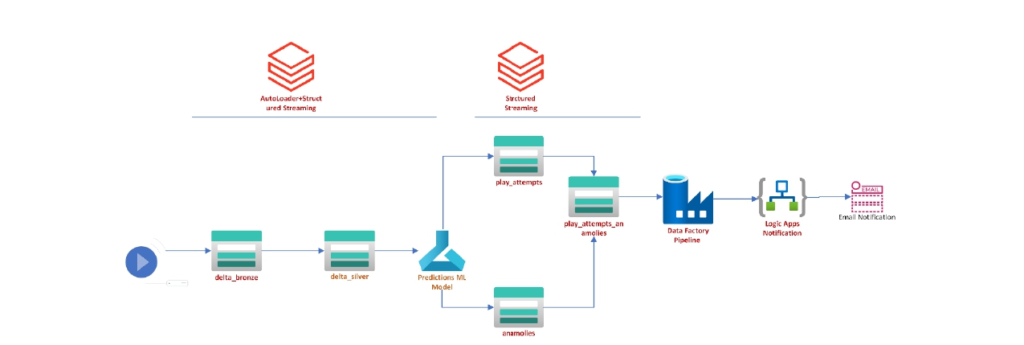
OTT Media Streaming Quality of Service Architecture
Key Take Aways: –
- Blob Storage Account
- Azure Data Factory
- Azure Key Vault
- Azure Data Lake Storage Gen2
- Azure Databricks + Auto Loader
- PySpark Structured Streaming
- Machine Learning- Use the prebuilt ML Model for predictions.
- Logic Apps for Email notification
- Medallion Architecture Implementation
When you start streaming you realize there are so many places where breaks can happen and the viewer experience can suffer, whether it be an issue at the source in the servers on-prem or in the cloud; in transit at either the CDN level or ISP level or the viewer’s home network; or at the playout level with player/client
Spark SQL
- Programmatic Advertisement Bidding (PAB) is the process by which companies buy and place ads online through automated auctions. Programmatic Advertisement Bidding (PAB) takes the work out of advertising by making it possible for advertisers to place hundreds and thousands of ads online, often in less than a second, without needing to individually reach out to online publishers.
- The value of PAB is that it creates greater transparency for both publishers and advertisers in the ad market:
- Publishers can better control their inventory and CPMs (cost per 1000 ad impressions)
- Advertisers that leverage PAB can boost advertising effectiveness by only bidding on impressions that are likely to be viewed by a given user.
We’ll implement the following data pipeline for Advertisement Viewability Predictions:
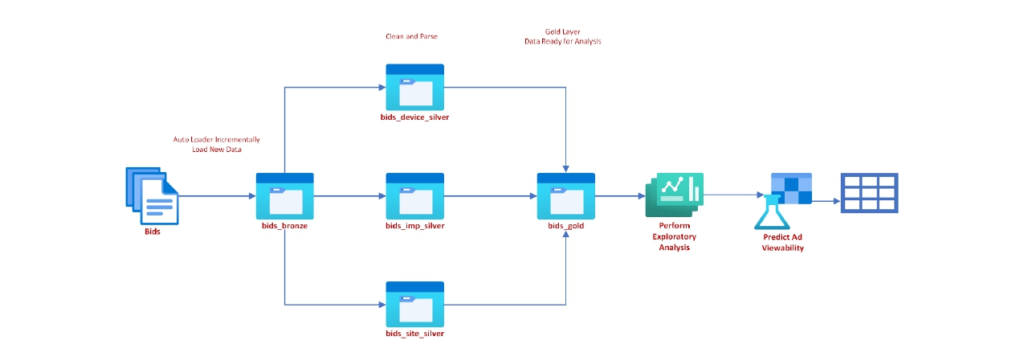
Advertisement Viewability Predictions Architecture
Key Take Aways: –
- Blob Storage Account
- Azure Data Factory
- Azure Key Vault
- Azure Data Lake Storage Gen2
- Azure Databricks + Auto Loader
- pySpark Structured Streaming
- Machine Learning- Use the prebuilt ML Model for viewability.
- Medallion Architecture Implementation
Viewability is a metric that measures whether an ad was seen by a user. This gives marketers a more precise measurement about whether their message appeared to users in a visible way. In this project, we demonstrate a process to predict viewability. Keep in mind, the more likely users are to see an ad, the higher the price a DSPs will want to place on a bid for that ad, because it is ultimately more valuable to the advertiser.